How to measure JavaScript code performance
If you want your website or app to work well, you have to make sure your JavaScript code is optimized and working as best as possible.
But to figure out which parts need to be improved, you need to know how to measure how well the JavaScript code is working.
In this article, I’m going to show you a few ways how to measure JavaScript code performance.
Browser Performance Tool
The first way to measure the performance of your code is to use the browser’s DevTools. Open DevTools and click the Performance tab (both on Chromium browsers and Firefox).
Click on the Record button and run your code. After the code is executed click Stop recording and you’ll see detailed results of the test.
You’ll see the time it takes to execute code, function names and links to JavaScript source file which points to a place in the code.
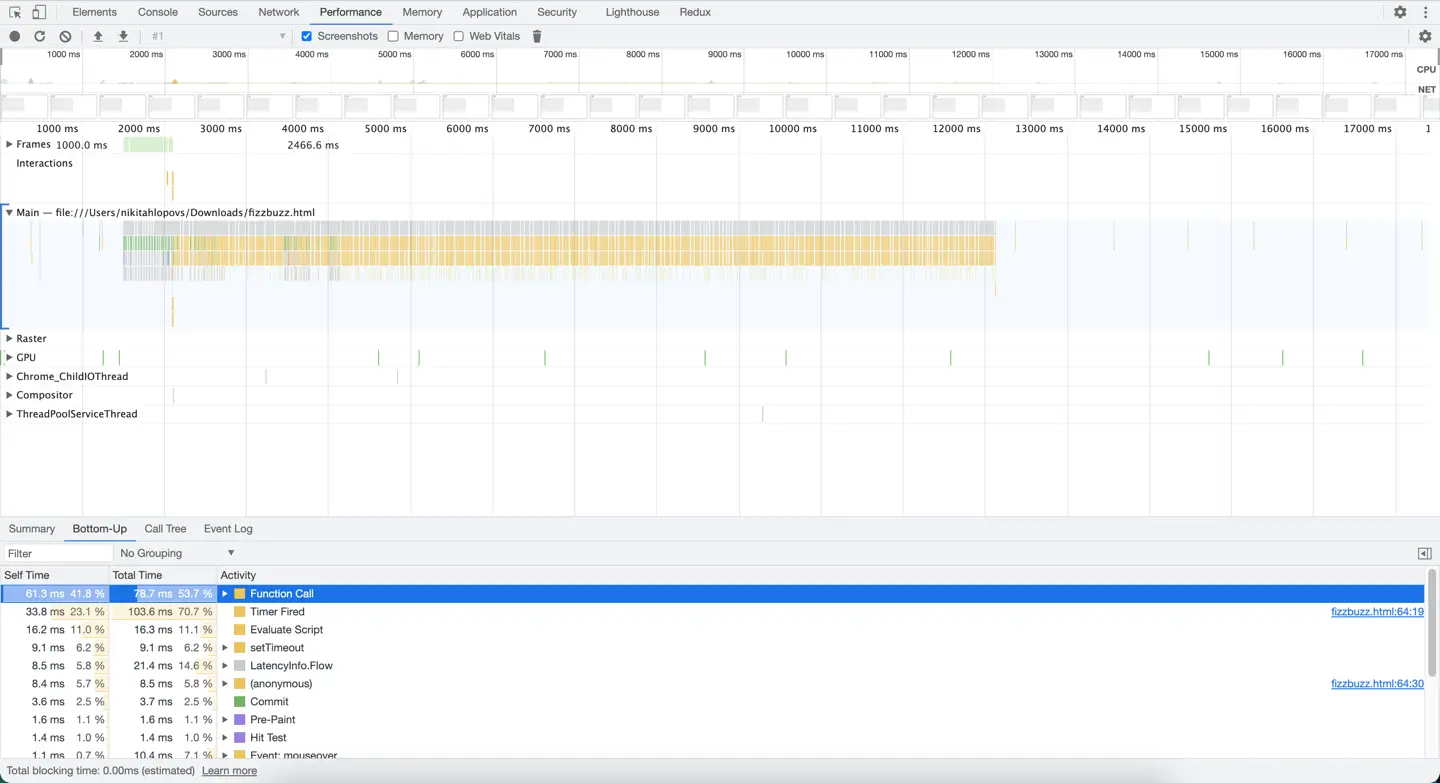
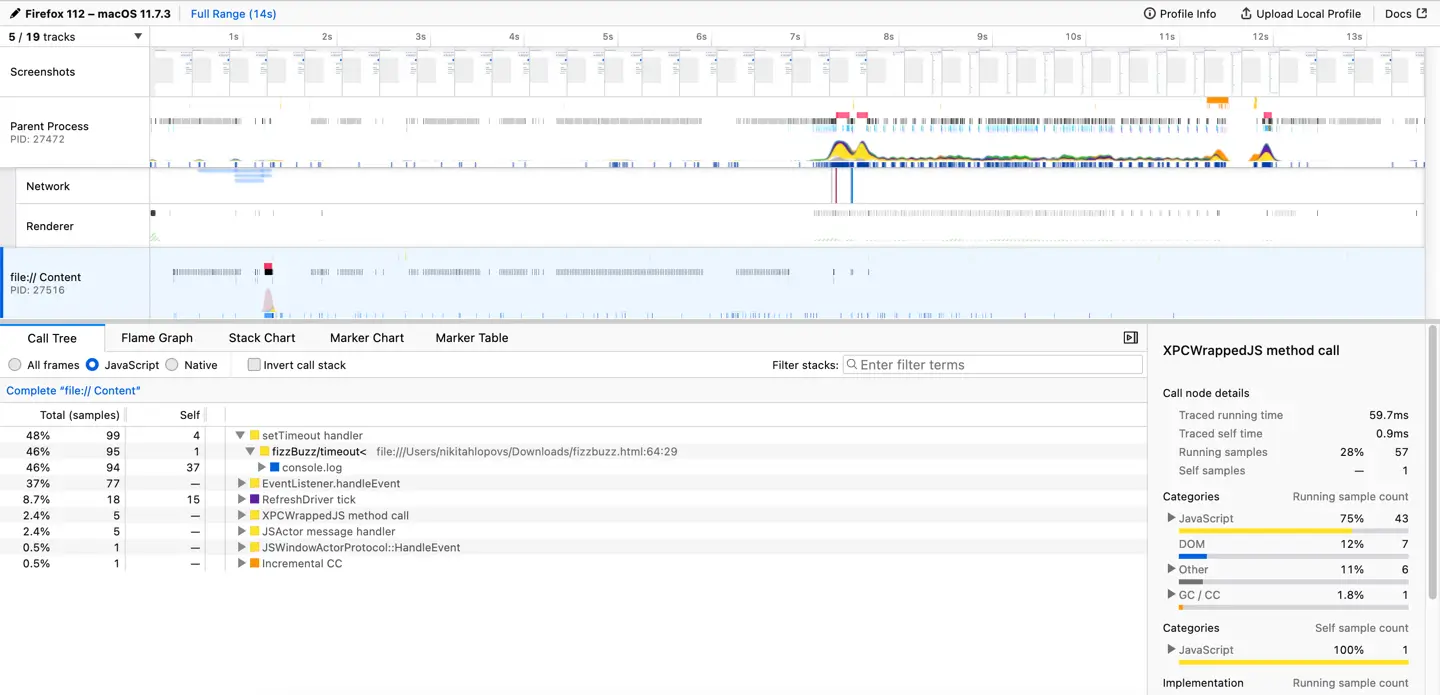
The profiling tool is useful to analyze code for possible bottlenecks, memory leaks, and other performance issues.
Both Chromium browsers and Firefox have great Profiling tools, make sure to check them out as they can help you a lot to analyze your code in detail.
Online Performance Tools
Another way how to measure code performance is to run benchmark tests with an online tool.
One of the most popular tools to run benchmark tests was jsperf.com. But it has been down for a long time.
A nice alternative is jsbench.me, it uses the Benchmark.js library (which you can also use locally for benchmark tests).
To measure performance with jsbench.me tool you’ll need to paste code to a Test case field and click on the Run test button. After some time it will display test results.
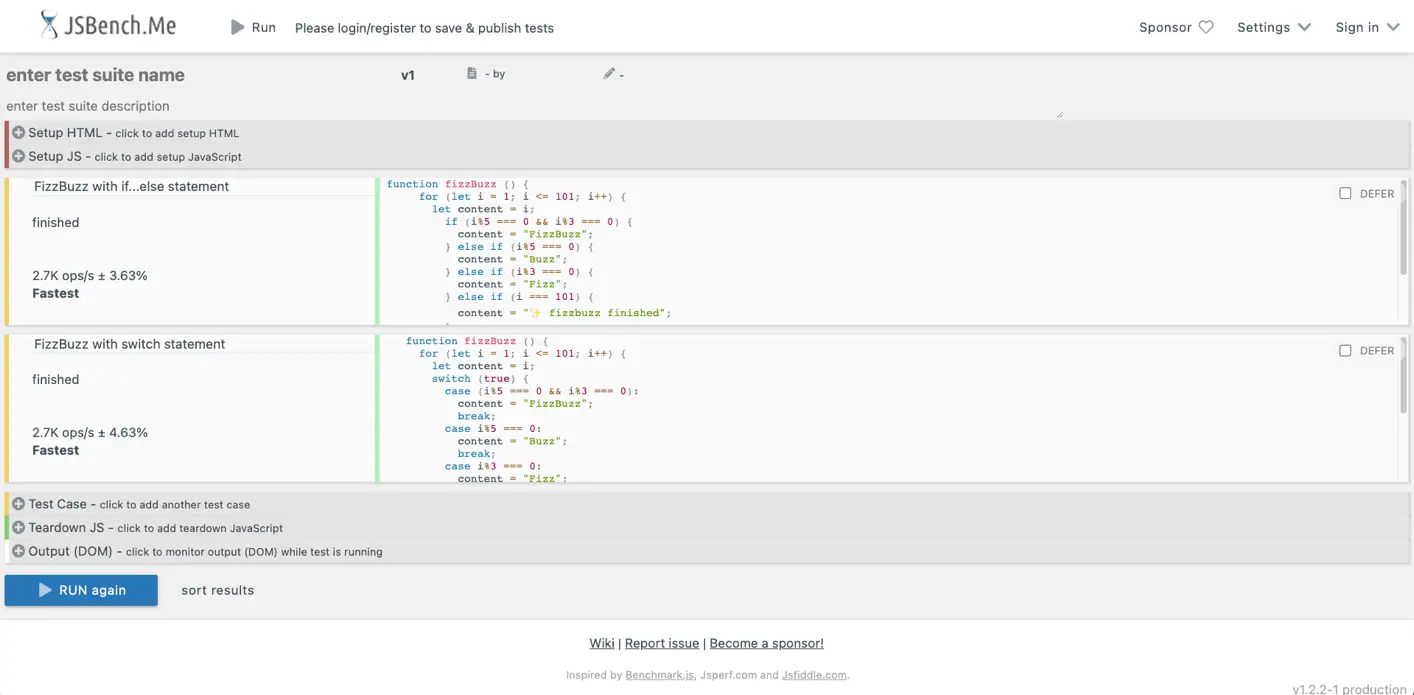
This tool won’t show you a detailed analysis of the code performance, nor will it show you code execution time. However, it is not its main purpose.
Use it to:
compare execution speed of different JavaScript code snippets
Code benchmark testing is quite handy when you need to find out which one of the multiple solutions works faster, like finding an item in an array.
JavaScript built-in methods
Finally, you can measure code execution time with JavaScript built-in methods.
For the sake of example, I’m going to use the FizzBuzz game to measure performance.
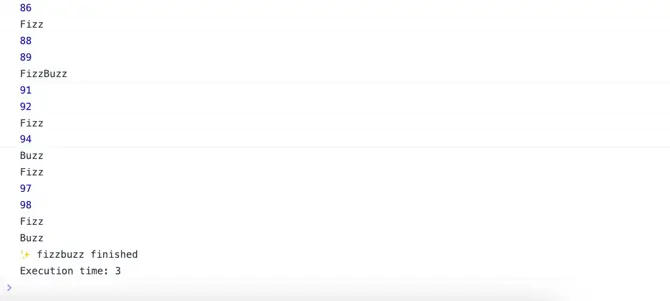
The given code will output the first 100 FizzBuzz numbers in the console. I’m going to run the fizzBuzz function in the following examples to measure execution time.
function fizzBuzz () {
  for (let i = 1; i <= 1001; i++) {
    let content = i;
    if (i%5 === 0 && i%3 === 0) {
      content = "FizzBuzz";
    } else if (i%5 === 0) {
      content = "Buzz";
    } else if (i%3 === 0) {
      content = "Fizz";
    } else if (i === 1001) {
      content = "✨ fizzbuzz finished";
    }
    console.log(content);
  }
}
JavaScript console.time() and console.timeEnd()
First, let’s take a look at some of the console methods. Console object has many useful methods, and timers are great for measuring performance.
To measure code execution time you can use console.time() and console.timeEnd() timer methods.
Call console.time() before the code you want to test and console.timeEnd() right after it.
If we look at the fizzBuzz function call it will look as follows:
console.time()
fizzBuzz()
console.timeEnd()

// The output will be all the logs from the fizzBuzz function followed by:
// default: 2.213134765625 ms
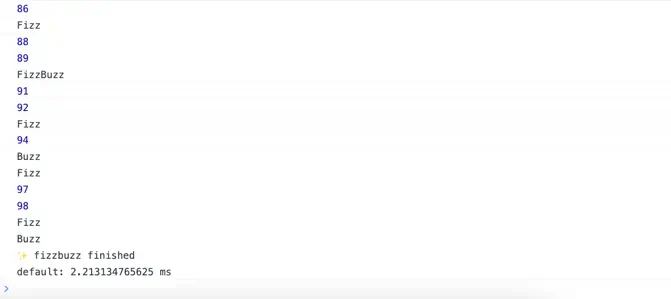
You can also pass a name parameter to each one of the timer methods to display the timer name instead of the default.
By specifying a timer name you can test multiple code blocks one by one and compare results right in the console.
console.time("FizzBuzz")
fizzBuzz()
console.timeEnd("FizzBuzz")

// The output will be all the logs from the fizzBuzz function followed by:
// FizzBuzz: 3.5419921875 ms

JavaScript performance.now()
Finally, you can use the performance.now() method, which returns a high resolution timestamp in milliseconds.
To measure code execution time, you’ll need to call performance.now() before and after the code you’re willing to test.
const timerStart = performance.now()
fizzBuzz()
const timerEnd = performance.now()

console.log(`Execution time: ${timerEnd - timerStart}`)

// Execution time: 3
